Comparison of doses
Each scenario and endpoint combination is characterized by two quantities (the consequence measured by the doses) taken from the assessment objects (cells marked in red in the corresponding table) and the probabilities defined as a property of the scenario. The user can define the probabilities qualitatively or quantitatively (see section 3.2.4). In the analysis mode SAFRAN creates summarizing tables and plots that can be useful for comparing the doses associated with different endpoints and scenarios.
SAFRAN creates one Table for comparison of doses inside and one for comparison of doses outside the facilities. Both these Tables have the same layout as Table 3.12 below.
Table 3.12. Comparison of doses inside and outside the facilities (one table for endpoints inside and one for endpoints outside
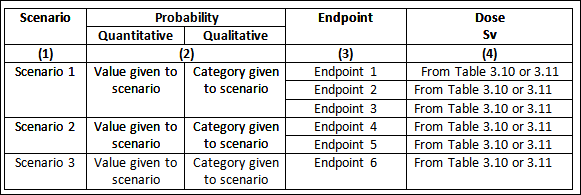
Definition of columns in Table 3.12:
- Column 1. Short name of the scenario.
- Column 2. Quantitative and Qualitative values of the probabilities.
- Column 3. Short name of the endpoint.
- Column 4. Dose inside or outside obtained for each endpoint.
Columns in Table 3.12 that can be modified by the user: Non of the values in this table can be directly modified by the user.
To complete Table 3.12, SAFRAN will first find the dose and probability values given for the user for each scenario-endpoint combination. If qualitative categories or quantitative values are given for probabilities, then these will be transferred to Table 3.12. Thereafter, SAFRAN will derive the qualitative categories or quantitative values corresponding to values defined by the user by using pre-defined scales of probabilities (see section 3.2.4). For example, if for one scenario the user gave quantitative values for the probabilities, then SAFRAN will derive the corresponding qualitative categories. In the exposure assessment doses are always given a quantitative value.