Charts
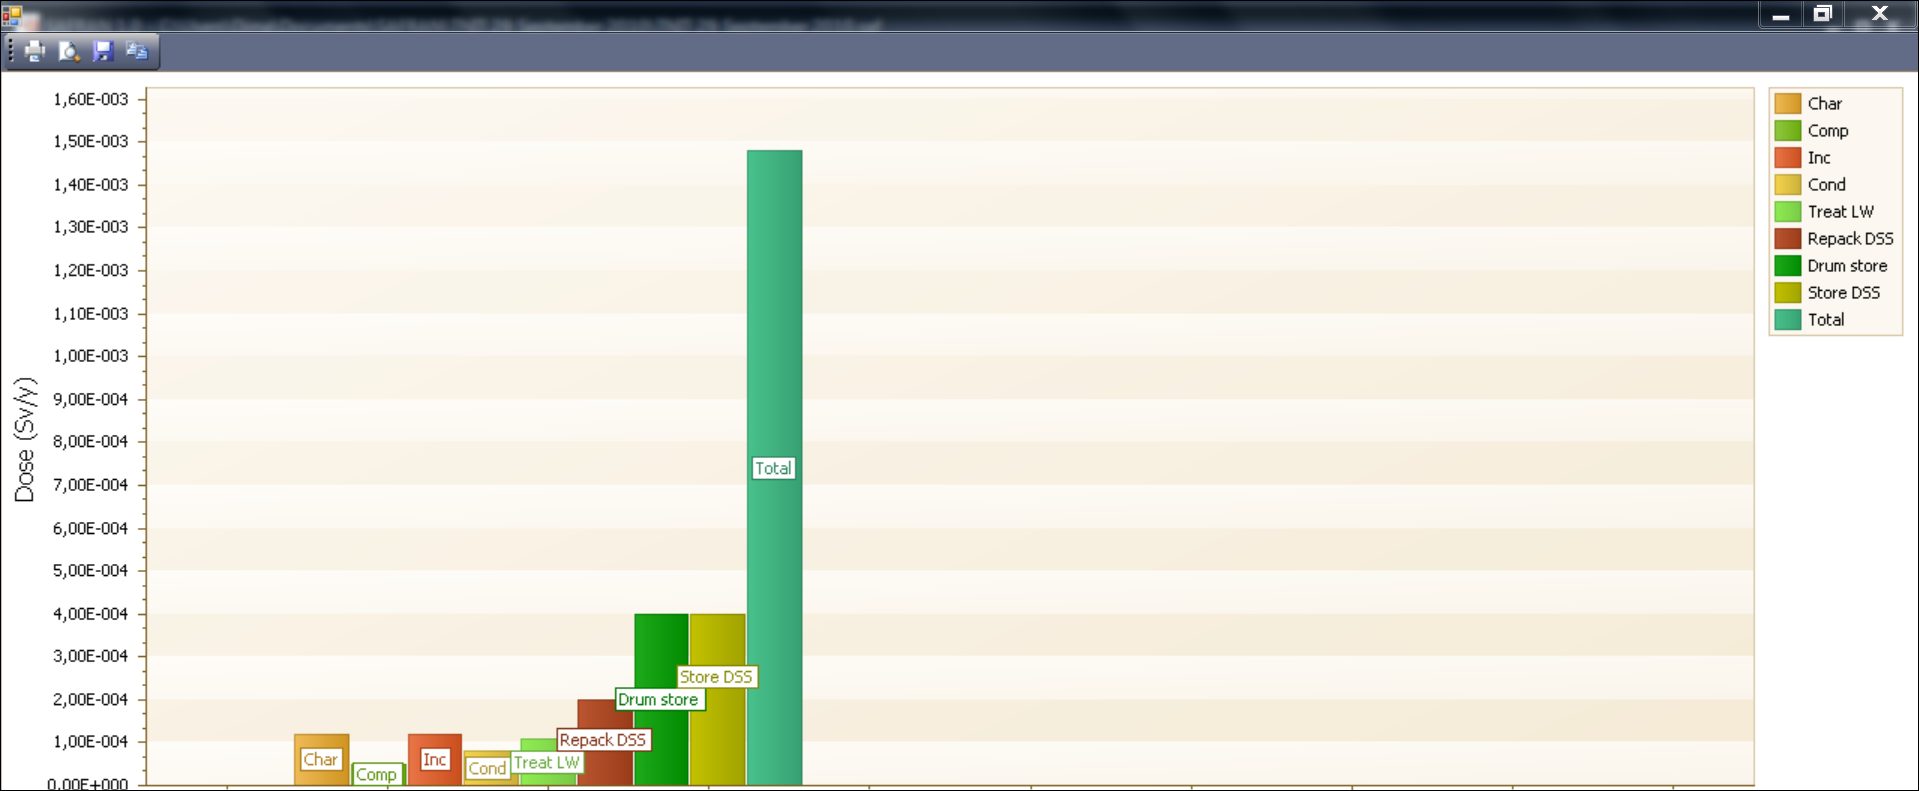
Information presented in several tables in SAFRAN can be also shown in chart form (as bar diagram or X-Y dots). These tables have the Show as chart button on the toolbar. Click on this button to open Charts window.
Charts are produced on the basis of the visisble rows in the table. If table contains a lot of rows, it is recommended to filter-out some of the rows to avoid presenting too much bars or dots on the chart.
Charts has the following important features:
-
In the Charts window, it is possible to show/hide bars and dots by double clicking on the corresponding icons located in the chart legend.
-
To print chart (without preview) - click Print button on the chart toolbar
-
SAFRAN provides advanced possibilities for chart print preview as well as exporting chart as PDF file or files in the numerous graphical formats with Print preview and export tool. Click on the Print preview button to invoke this tool.
-
To quickly save as chart as PNG format - click Save as button on the toolbar.
-
To copy chart (as image) to clipboard - click Copy button located on the toolbar.
-
Clicking on the one of bars shown on the chart will highlight the bar and the corresponding icon in legend window.
See also Export chart